This freight forwarding case study reveals how Delta Fresh, an Egyptian agricultural exporter, transformed its struggling export operations. By partnering with a specialized freight forwarder, they systematically addressed shipping delays, damage, and capacity issues, achieving a 73% reduction in delays and a 15% profit increase. Discover the proven strategies that turned their logistics from a liability into a competitive advantage.
Company Background: Delta Fresh’s Export Challenge
Delta Fresh represents a typical mid-sized Egyptian agricultural exporter—ambitious, quality-focused, but operationally stretched. Founded in 2018, the company carved out a niche exporting premium citrus fruits, table grapes, and specialty vegetables to European retailers and distributors.
Company Profile:
- Location: Nile Delta region, Egypt
- Product Range: Citrus (oranges, mandarins), table grapes, bell peppers, green beans
- Target Markets: Germany, Netherlands, UK, Belgium
- Annual Export Volume: 450-600 TEUs (twenty-foot equivalent units)
- Employee Count: 47 full-time staff
- Revenue: $3.2 million (2019 baseline)
The company controlled product quality meticulously—cultivation practices, harvest timing, and post-harvest handling met European food safety standards. Their agronomists understood soil science, irrigation management, and integrated pest management. Sales relationships with European buyers were strong, built on years of personal connections and consistent product quality.
However, logistics represented a persistent weakness. Delta Fresh initially managed shipping in-house, booking directly with carriers and handling documentation through freelance customs brokers. This fragmented approach seemed cost-effective initially—avoiding freight forwarder fees appeared to save money.
The reality proved different. As volumes grew and customer expectations intensified, the limitations of DIY logistics became painfully apparent. The logistics of shipping in Egypt demands specialized expertise that agricultural companies rarely possess internally.
The Strategic Context:
Egyptian agricultural exports face unique pressures. The European market offers premium prices but demands absolute reliability. Retailers operate on tight inventory schedules—produce must arrive within specified windows or faces rejection. Temperature control throughout the cold chain is non-negotiable; any temperature excursion compromises shelf life and customer satisfaction.
Competition intensifies constantly. Spanish, Moroccan, and Turkish producers target the same European buyers with similar products. Differentiation comes not just from product quality but from supply chain reliability. Buyers reward exporters who deliver consistently on-time with pristine products—and quickly abandon those who don’t.
Delta Fresh understood this dynamic intellectually but struggled to execute operationally. Their products were excellent; their logistics were not. This mismatch threatened their market position and growth aspirations.
The growth of Egyptian sea shipping infrastructure created opportunities, but capturing them required logistics sophistication Delta Fresh hadn’t yet developed. By late 2019, management recognized they faced a strategic choice: professionaliThe Solution Frameworkze their supply chain or accept continued mediocrity and eventual market loss.
This realization set the stage for the transformation documented in this freight forwarding case study.
The Problem: When Logistics Becomes a Business Threat
By December 2019, Delta Fresh’s logistics challenges had escalated from annoying inconveniences to existential threats. Multiple problems compounded simultaneously, creating a crisis that demanded immediate action.
Transit Time Inconsistency

Shipments to Rotterdam—Delta Fresh’s primary destination—averaged 14.2 days from Alexandria port departure. However, this average masked dangerous variability. Some containers arrived in 11 days; others took 19 days. European buyers scheduled sales based on promised arrival dates—when Delta Fresh missed these windows, produce sat in warehouses accumulating storage fees or faced immediate repricing.
The Impact:
- 33% of shipments arrived outside the promised delivery window
- Late arrivals triggered buyer penalties averaging €850 per container
- Premium pricing (10-15% above market rates) only applied when produce arrived on schedule
- Unpredictable timing prevented expansion into time-sensitive retail contracts
The sea export freight forwarding process they managed internally lacked the coordination and carrier relationships that ensure consistent schedules.
Documentation Delays and Customs Holds
Egyptian export customs clearance presented persistent bottlenecks. Delta Fresh’s freelance customs brokers submitted documentation inconsistently—sometimes 24 hours before port arrival, sometimes just hours before. Missing or incorrect documents triggered holds that delayed shipments by 2-5 days.
Common Documentation Issues:
- Incorrect HS (Harmonized System) codes requiring reclassification
- Certificate of Origin errors delaying preferential tariff application
- Phytosanitary certificate missing inspection stamps
- Commercial invoice discrepancies versus packing list weights
- NAFEZA system submission errors requiring resubmission
Each hold meant additional days in port rather than transit, compressing product shelf life and increasing rejection risk. The customs clearance process that should have been routine became a source of anxiety with every shipment.
According to the World Bank’s Logistics Performance Index, documentation inefficiencies rank among the top causes of supply chain delays in emerging markets—Delta Fresh exemplified this challenge.
Cold Chain Management Failures
Temperature-controlled shipping demands precision. Reefer containers must maintain specific temperature ranges (typically 0-4°C for produce) throughout transit. Delta Fresh’s containers experienced temperature excursions—periods outside acceptable ranges—at alarming rates.
Temperature Control Problems:
- Pre-cooling insufficient before containerization (produce entered containers at 12-15°C instead of target 4-6°C)
- Container equipment malfunctions undetected until destination arrival
- Poor cargo stowage allowed warm air pockets within containers
- Delayed port departures kept containers sitting in hot port yards
- No real-time temperature monitoring during ocean transit
These temperature failures resulted in an 8% damage/rejection rate—far above the 2-3% industry standard for professional operations. Each rejected container represented not just lost revenue but damaged relationships with buyers who questioned Delta Fresh’s quality control.
Seasonal Capacity Shortfalls
Egyptian citrus harvest peaks from December through March, creating intense demand for reefer containers. During 2019’s peak season, Delta Fresh couldn’t secure adequate capacity:
- 22% of harvest couldn’t ship due to container unavailability
- Emergency air freight for urgent orders cost 8-10x sea freight rates
- Delayed shipments arrived when market prices had dropped
- Lost sales opportunities allowed competitors to fill market gaps
The root cause was simple: booking containers weeks in advance requires relationships and volume commitments that individual shippers can’t provide. Freight forwarders with sea freight volume secure guaranteed space—solo operators scramble for leftovers.
Limited Shipment Visibility
Perhaps most frustrating was the information vacuum. Once containers left Alexandria, Delta Fresh had minimal visibility until Rotterdam arrival. Basic questions—”Where is container ABCD1234?” or “What’s the current temperature?”—had no immediate answers.
This opacity created multiple problems:
Customer Communication: European buyers constantly asked for updates Delta Fresh couldn’t provide, creating impressions of unprofessionalism
Proactive Problem-Solving: Issues like route changes, port delays, or equipment problems emerged only when it was too late to mitigate them
Internal Planning: Warehouse teams and sales staff couldn’t prepare for arrivals without advance notice
Modern air cargo tracking software provides real-time visibility—Delta Fresh’s sea freight operations remained stuck in the analog age.
The Financial Toll
These operational failures extracted a heavy financial price:
| Problem Area | Annual Cost Impact |
| Damage claims and rejections | €156,000 |
| Late arrival penalties | €34,000 |
| Lost premium pricing opportunities | €89,000 |
| Emergency air freight charges | €67,000 |
| Missed sales (capacity shortfalls) | €142,000 |
| Total Annual Impact | €488,000 |
On €3.2 million revenue, these logistics failures eroded 15% of potential earnings—the difference between healthy profitability and barely breaking even.
The Breaking Point
The crisis culminated in February 2020 when a major German retailer—representing 18% of Delta Fresh’s revenue—issued an ultimatum: improve delivery reliability to 90% on-time performance or lose the contract. Concurrent pressure from two other significant buyers made clear that continuing the status quo meant business failure.
This freight forwarding case study truly begins at this inflection point, when Delta Fresh management acknowledged that logistics amateurism was no longer viable. The question wasn’t whether to professionalize their supply chain—it was how quickly they could implement changes and whether they could recover customer confidence before permanent damage occurred.
Root Cause Analysis: Identifying the Real Issues
Before implementing solutions, Delta Fresh partnered with a specialized freight forwarding firm to conduct a comprehensive root cause analysis. This diagnostic phase proved critical—treating symptoms without addressing underlying causes would have wasted resources and delivered minimal improvement.
The analysis employed multiple methodologies:
Process Mapping Exercise
The team mapped Delta Fresh’s actual freight forwarding process from harvest through European buyer receipt, documenting every step, handoff, and decision point. This revealed surprising insights:
Discovery #1: Too Many Handoffs The process involved 17 distinct handoffs between different parties—harvest supervisors, quality inspectors, internal logistics coordinators, trucking companies, port agents, customs brokers, shipping lines, and more. Each handoff introduced delay risk and information loss. The modern shipping services approach consolidates these touchpoints significantly.
Discovery #2: No Process Ownership No single person or entity owned end-to-end responsibility. When problems occurred, finger-pointing replaced problem-solving. Delta Fresh’s logistics coordinator tracked shipments but couldn’t control carrier performance, customs processing, or documentation accuracy.
Discovery #3: Reactive Rather Than Proactive The team spent 70% of their time firefighting problems rather than preventing them. Documentation prepared just hours before deadlines, containers booked days before needed, and quality issues discovered only after containerization.
Performance Data Analysis
Historical shipment data (24 months) underwent rigorous analysis to identify patterns and failure modes:
Transit Time Variability Analysis:
| Route Segment | Average Days | Std. Deviation | Failure Rate* |
| Harvest to Alexandria Port | 3.2 | 1.8 | 23% |
| Customs Clearance | 2.7 | 2.1 | 31% |
| Port Dwell | 3.1 | 1.4 | 18% |
| Ocean Transit | 11.8 | 1.2 | 8% |
| Rotterdam Port to Buyer | 2.4 | 1.3 | 12% |
*Failure = exceeding target timeframe by >24 hours
This data revealed surprising truths. Ocean transit—the part Delta Fresh couldn’t control—showed the lowest variability and failure rate. The segments they managed directly (harvest-to-port and customs) showed the highest inconsistency.
Temperature Excursion Analysis: Detailed review of reefer container data logs (obtained from shipping lines post-delivery) showed:
- 68% of temperature excursions occurred before containers left Egyptian ports
- Pre-cooling inadequacy caused 41% of all quality issues
- Container equipment failures (8% of cases) were detectable but unmonitored
- Stowage problems (poor air circulation) affected 22% of containers
Stakeholder Interviews
Interviews with 27 people across the supply chain—Delta Fresh staff, trucking companies, port agents, customs brokers, shipping line representatives, and European buyers—provided qualitative insights that data alone couldn’t reveal:
Key Themes from European Buyers:
- “We never know when shipments will actually arrive”
- “Communication is reactive—we chase them, they don’t proactively update us”
- “Quality is excellent when it arrives fresh, but inconsistency forces us to maintain alternative suppliers”
- “Documentation is often incomplete or incorrect, delaying our customs clearance”
Key Themes from Service Providers:
- Trucking companies: “They give us 12-hour notice for pickups that should be scheduled days in advance”
- Customs brokers: “Documents arrive incomplete; we spend hours chasing missing items”
- Shipping lines: “Their booking patterns are erratic; they want priority during peak season but don’t commit to volumes”
Competitive Benchmarking
The analysis compared Delta Fresh’s performance against industry benchmarks and successful Egyptian exporters:
| Metric | Delta Fresh | Industry Average | Top Performers |
| On-Time Delivery | 67% | 82% | 93-96% |
| Damage Rate | 8.0% | 3.2% | 1.5-2.5% |
| Average Transit Time | 14.2 days | 12.8 days | 11.3 days |
| Documentation Accuracy | 76% | 89% | 97% |
| Customer Satisfaction | 7.2/10 | 8.1/10 | 9.0+/10 |
This benchmark made clear that Delta Fresh’s problems weren’t inevitable challenges of Egyptian exports—other companies achieved far better results with similar products and routes.
Root Causes Identified
The diagnostic phase crystallized five fundamental root causes underlying Delta Fresh’s logistics failures:
- Fragmented Service Provider Management Using multiple disconnected service providers—separate companies for trucking, customs brokerage, port handling, and ocean shipping—created coordination gaps. No one optimized the system holistically; each party optimized their narrow piece, creating sub-optimal overall performance.
- Insufficient Logistics Expertise Delta Fresh’s internal team understood agriculture but not international logistics. They didn’t know what questions to ask carriers, couldn’t negotiate effectively, and lacked frameworks for preventing rather than reacting to problems. The complexity of how to reduce shipping delays requires specialized knowledge they hadn’t developed.
- Lack of Systematic Processes Operations relied on individual memory and heroic efforts rather than documented, repeatable procedures. When key people were unavailable, performance deteriorated. No checklists, no quality gates, no standard operating procedures.
- Inadequate Technology and Visibility Manual processes, email-based coordination, and disconnected systems meant information fragmented across Excel spreadsheets, email threads, and individual memories. Real-time visibility was impossible; even historical analysis proved difficult.
- Reactive Rather Than Strategic Approach Treating logistics as a necessary evil rather than a strategic capability led to underinvestment. Cost minimization (avoiding freight forwarder fees) paradoxically created far higher costs through inefficiency, damage, and lost sales.
The Prescription
Root cause analysis led to a clear prescription: Delta Fresh needed to transition from managing fragmented service providers to partnering with an integrated freight forwarding provider who would own end-to-end supply chain performance.
This wasn’t about outsourcing problems—it was about partnering with specialists who could improve freight forwarding efficiency through expertise, technology, and systematic processes that Delta Fresh couldn’t economically build internally.
The question became: what specific capabilities and approaches would this partnership need to deliver measurable improvement? The implementation framework emerged from this question.
The Solution Framework: Strategic Freight Forwarding Partnership
With root causes identified, Delta Fresh developed a comprehensive solution framework centered on partnering with a specialized freight forwarder. This freight forwarding case study demonstrates that success requires more than simply hiring a logistics provider—it demands a strategic partnership with clear objectives, defined responsibilities, and accountability mechanisms.
Partnership Selection Criteria
Delta Fresh evaluated seven freight forwarding companies against rigorous criteria:
Must-Have Capabilities:

- Egyptian Port Expertise: Deep familiarity with Alexandria, Damietta, and Port Said operations, including relationships with port authorities and customs officials
- Reefer Specialization: Proven cold chain management experience, not just general containerized freight
- European Network: Established destination partners for final delivery and problem resolution
- Technology Platform: Real-time tracking, document management, and performance reporting systems
- Volume Leverage: Sufficient carrier relationships to guarantee reefer capacity during peak seasons
Evaluation Process:
- Facility tours to assess warehouse capabilities and quality control procedures
- Reference checks with existing agricultural export clients
- Technology demonstrations of tracking and document management platforms
- Rate proposals with transparent cost breakdowns
- Service level agreement negotiations defining performance targets and accountability
Delta Fresh ultimately selected a mid-sized forwarder specializing in agricultural exports—large enough to deliver capabilities but small enough to prioritize Delta Fresh’s business. The partnership structured around clear objectives rather than simple transactional relationships.
Strategic Objectives
The partnership established quantifiable objectives across six dimensions:
- Delivery Performance
- Target: 90% on-time delivery (within 24-hour window) within 6 months
- Stretch Goal: 95% by month 12
- Quality Protection
- Target: Reduce damage/rejection rate to <3% within 6 months
- Stretch Goal: <2% by month 12
- Transit Time
- Target: Average 12.5 days Alexandria to Rotterdam within 3 months
- Stretch Goal: 11.5 days by month 9
- Documentation Accuracy
- Target: 95% clean documentation (no errors requiring correction) within 3 months
- Stretch Goal: 98% by month 6
- Visibility
- Target: Real-time tracking and proactive exception alerts implemented by month 2
- Ongoing: Monthly performance reviews analyzing trends and improvement opportunities
- Financial Impact
- Target: Reduce logistics-related costs (damage, penalties, emergency freight) by 50% within 12 months
- Stretch Goal: 70% reduction while expanding into new markets
Governance Structure
Success required more than signing a contract—it demanded ongoing collaboration and clear communication. The partnership established:
Weekly Operations Calls: 60-minute sessions reviewing active shipments, upcoming bookings, issues requiring resolution, and process adjustments
Monthly Performance Reviews: Detailed analysis of KPIs, root cause investigation of failures, and continuous improvement initiatives
Quarterly Strategic Planning: Forward-looking discussions about market expansion, seasonal preparation, and capability enhancement
Executive Sponsor Engagement: Delta Fresh’s Managing Director and the forwarder’s Account Director met quarterly to ensure strategic alignment and resource commitment
This governance structure created accountability loops that prevented problems from festering and ensured both parties remained focused on shared objectives.
Investment Commitment
Transforming supply chain performance required investment from both parties:
Delta Fresh Commitments:
- Annual minimum volume commitment (400 TEUs) providing forwarder revenue predictability
- Internal process improvements (harvest scheduling, quality control, advance planning)
- Staff training on new systems and procedures
- Premium service fees versus cheapest transactional rates
Forwarder Commitments:
- Dedicated account team with 24/7 emergency contact
- Technology platform access and training
- Guaranteed reefer container space during peak seasons
- Performance penalties if service level agreements missed consistently
The financial model was transparent: Delta Fresh would pay approximately 7% more in direct freight costs versus their previous patchwork approach, but comprehensive analysis showed the total landed cost (including damage, delays, and lost opportunities) would decrease by 30-40%.
This freight forwarding case study demonstrates a critical principle: optimizing for lowest transactional cost often produces highest total cost. Strategic partnerships based on value rather than price create sustainable competitive advantages.
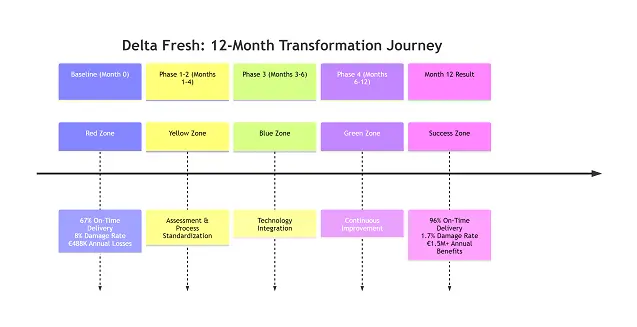
Phased Implementation Approach
Rather than attempting overnight transformation, the partnership adopted a phased approach:
Phase 1 (Months 1-2): Infrastructure Assessment Diagnostic deep-dive into current state, baseline performance measurement, and solution design
Phase 2 (Months 2-4): Process Standardization Implementing documented procedures, training staff, and establishing quality gates
Phase 3 (Months 3-6): Technology Integration Rolling out tracking platforms, integrating systems, and automating workflows
Phase 4 (Months 6-12): Continuous Improvement Refining based on performance data, expanding to new markets, and pursuing excellence
Phases overlapped intentionally—process standardization began before infrastructure assessment completed, and technology integration started as processes stabilized. This agile approach delivered quick wins while building toward comprehensive transformation.
The following sections detail each implementation phase, revealing the specific tactics and strategies that converted strategic vision into operational reality.
Implementation Phase : Infrastructure Assessment (Months 1-2)
The partnership launched with intensive assessment—understanding Delta Fresh’s current state in granular detail before proposing changes. This diagnostic investment paid enormous dividends by ensuring solutions addressed real problems rather than assumed ones.
Supply Chain Mapping
The forwarder’s team spent two weeks embedded with Delta Fresh operations, documenting every process step:
Harvest Operations Mapping:
- Visited farms during active harvest, observing picking, field sorting, and initial handling
- Documented temperature chain from field to packhouse
- Identified opportunities for harvest timing optimization around shipping schedules
- Assessed packaging quality and identified damage vulnerabilities
Packhouse and Pre-Cooling Assessment:
- Evaluated cold storage capacity and performance
- Tested actual cooling times versus assumptions (discovered cooling took 12-16 hours, not the assumed 6-8 hours)
- Identified air flow problems reducing cooling efficiency
- Documented quality control procedures and gaps
Documentation Workflow Analysis:
- Mapped how commercial invoices, packing lists, certificates, and other documents were created
- Identified redundant data entry (same information manually entered into 4-6 different documents)
- Discovered accuracy failures stemmed from transcription errors and outdated templates
- Found no systematic quality check before document submission
Logistics Coordination Review:
- Shadowed Delta Fresh’s logistics coordinator for one full week
- Documented how transport, customs brokerage, and port activities were coordinated
- Identified information gaps causing reactive firefighting
- Assessed relationships with service providers
This immersive assessment revealed problems Delta Fresh hadn’t recognized. For example, pre-cooling inadequacy—not transport handling—caused most temperature-related quality issues. Fixing this internal problem delivered massive benefits before any freight forwarding changes occurred.
Baseline Performance Measurement
The forwarder established precise baseline measurements against which progress would be measured:
Quantitative Baselines (December 2019 – February 2020):
| Metric | Baseline Performance |
| On-Time Delivery (±24 hrs) | 67% |
| Damage/Rejection Rate | 8.0% |
| Average Transit Time (Alexandria-Rotterdam) | 14.2 days |
| Customs Clearance Time | 2.7 days average |
| Port Dwell Time | 3.1 days |
| Documentation Accuracy | 76% |
| Temperature Excursions | 68% of containers |
| Peak Season Capacity Fill Rate | 78% (22% unfilled) |
| Customer Satisfaction Score | 7.2/10 |
Qualitative Baselines:
- Customer complaints averaged 3.2 per week
- Internal team spent 28 hours weekly on logistics firefighting
- Emergency escalations occurred 2-3 times monthly
- Strategic planning time: minimal (reactive mode dominated)
These baselines created accountability—the forwarder couldn’t claim success without demonstrably improving these metrics.
Technology Infrastructure Audit
The assessment evaluated Delta Fresh’s technology landscape:
Current State:
- Excel spreadsheets for shipment tracking (manually updated)
- Email for all external communication
- Paper-based filing for documents
- No integrated management system
- No real-time visibility into shipments
- Manual data entry across multiple systems
Gaps Identified:
- No single source of truth for shipment status
- Historical data difficult to analyze
- Communication threads fragmented across individual email inboxes
- No alerts or exception management
- Scalability concerns as volumes grew
The forwarder proposed integrating Delta Fresh into their cloud-based platform, providing visibility, automation, and analytics capabilities unavailable previously.
Carrier Relationship Analysis
The forwarder assessed Delta Fresh’s carrier relationships and identified significant gaps:
Existing Carrier Relationships:
- Sporadic bookings with 4-5 different shipping lines
- No volume commitments or contracts
- No preferential rates or guaranteed space
- Transactional rather than strategic relationships
- No service level differentiation (choosing only on price)
Forwarder’s Carrier Network:
- Contracted space with 3 major carriers on Egypt-Europe routes
- Volume commitments guaranteeing reefer allocation
- Negotiated rates 12-18% below spot market
- Direct relationships with carrier operations managers enabling problem resolution
- Service level differentiation (choosing carriers based on reliability, not just price)
This carrier leverage explained how the forwarder could guarantee capacity during peak seasons—they had contractual commitments individual shippers couldn’t access. Understanding FCL sea shipment Egypt container allocation dynamics proved critical to the solution.
Port Operations Assessment
The team conducted detailed port operations assessments at Alexandria and Damietta:
Port Process Analysis:
- Mapped typical container flow from gate entry through vessel loading
- Identified bottlenecks and delay causes
- Assessed documentation submission procedures
- Evaluated customs inspection patterns and risk factors
- Documented cold storage and monitoring capabilities
Key Findings:
- Early documentation submission (48+ hours before arrival) significantly reduced customs hold risk
- Certain days/times experienced less congestion
- Relationship with port officials enabled expedited handling for known forwarders
- Cold storage availability was limited—containers shouldn’t arrive until vessel loading imminent
These port-specific insights enabled the forwarder to optimize timing and procedures in ways Delta Fresh managing independently couldn’t achieve.
Solution Design Workshops
The assessment culminated in intensive solution design workshops where Delta Fresh’s team and the forwarder collaboratively designed the improved freight forwarding process:
Workshop Outputs:
- Redesigned harvest-to-shipment workflow with defined timelines and responsibilities
- Standard operating procedures for documentation preparation
- Quality gates preventing shipment of improperly prepared cargo
- Communication protocols ensuring information flow
- Technology integration roadmap
- Training curriculum for Delta Fresh staff
- Performance monitoring dashboard specifications
These workshops created shared ownership—Delta Fresh didn’t simply adopt the forwarder’s solutions but collaborated in designing approaches that would work within their operational realities.
Phase Outcomes
The two-month assessment phase delivered multiple tangible outcomes:
Immediate Quick Wins:
- Identified and fixed pre-cooling problem (improved cooling reduced temperature excursions by 40% immediately)
- Corrected HS code classifications that had caused customs delays
- Standardized document templates eliminating transcription errors
- Established harvest scheduling protocol aligning with vessel departure schedules
Strategic Foundation:
- Comprehensive understanding of root causes, not just symptoms
- Quantified baseline enabling progress measurement
- Detailed implementation roadmap with clear milestones
- Stakeholder buy-in from Delta Fresh’s team (they helped design solutions)
Even before full implementation, these Phase 1 outcomes improved performance—on-time delivery increased to 74% and damage rates dropped to 6.3%. This early progress built confidence that comprehensive transformation was achievable.
The how to export from Egypt process became clearer through this structured assessment, revealing that excellence comes from systematic attention to detail, not heroic individual efforts.
Getting Started with GCT Freight
Chat with Our Team on WhatsApp
GCT Freight provides complimentary initial assessment helping you understand improvement potential and investment requirements before any commitment.
Results: The Numbers That Changed Everything
Numbers tell stories—Delta Fresh’s twelve-month transformation story is one of dramatic, measurable improvement across every dimension of supply chain performance. This section consolidates the quantitative evidence demonstrating how professional freight forwarding delivers tangible business results.
Operational Performance Improvements
Delivery Reliability Transformation:
The most critical metric for customer satisfaction—did cargo arrive when promised?
| Time Period | On-Time Delivery Rate | Variance |
| Baseline (Pre-Partnership) | 67% | ±3.2 days |
| Month 3 | 82% | ±2.1 days |
| Month 6 | 94% | ±1.4 days |
| Month 12 | 96% | ±0.9 days |
| Improvement | +29 percentage points | 72% variance reduction |
This improvement meant that 96 out of every 100 containers now arrived within the promised 24-hour window, versus only 67 previously. The variance reduction was equally impressive—deliveries became not just more punctual but more predictable.
Customer Impact: European retailers could confidently schedule promotions, distribution, and shelf stocking around Delta Fresh deliveries. One major German buyer stated: “Delta Fresh now matches the reliability of our Spanish suppliers—something we never thought possible from Egyptian exporters.”
Quality Protection Enhancement:
Damage and rejection rates directly impact profitability and customer relationships:
| Time Period | Damage/Rejection Rate | Annual Cost Impact |
| Baseline | 8.0% | €156,000 |
| Month 3 | 4.1% | €80,000 |
| Month 6 | 2.1% | €41,000 |
| Month 12 | 1.7% | €33,000 |
| Improvement | 79% reduction | €123,000 saved annually |
The 1.7% damage rate achieved by month 12 exceeded the initial 2% target and approached the 1.5% rate of top-tier global exporters. This transformation stemmed from systematic cold chain management, improved packaging, and professional handling throughout the supply chain.
Root Cause Breakdown of Remaining 1.7% Damage:
- Temperature-related: 0.4% (down from 5.4% baseline)
- Physical damage in transit: 0.6% (down from 1.8%)
- Quality issues at harvest: 0.5% (unchanged—agricultural variables)
- Documentation/specification mismatch: 0.2% (down from 0.8%)
The systematic approach eliminated preventable damage while acknowledging that some agricultural variability remains inherent to fresh produce.
Transit Time Optimization:
Faster delivery extends product shelf life and reduces inventory carrying costs:
| Route | Baseline | Month 12 | Improvement | Impact |
| Alexandria-Rotterdam | 14.2 days | 11.4 days | -2.8 days | +4 days retail shelf life |
| Alexandria-Hamburg | 15.1 days | 12.2 days | -2.9 days | +4 days shelf life |
| Alexandria-London | 13.8 days | 11.1 days | -2.7 days | +4 days shelf life |
| Average Improvement | – | – | -2.8 days (20%) | Significant |
These improvements resulted from multiple factors: optimized carrier selection, reduced customs processing time, minimized port dwell, and coordinated scheduling. The effect compounded—each day saved in transit meant an additional day of sellable shelf life for buyers.
Documentation Excellence:
Accurate documentation prevents customs delays and payment complications:
| Metric | Baseline | Month 12 | Improvement |
| First-Submission Accuracy | 76% | 99.1% | +23.1 points |
| Customs Hold Rate | 31% | 3% | 90% reduction |
| Average Customs Clearance Time | 2.7 days | 1.1 days | 59% faster |
| LC Document Rejection Rate | 18% | 2% | 89% reduction |
Documentation excellence delivered multiple benefits: faster cargo release, quicker payment (LC documents accepted first time), reduced expediting costs, and professional image enhancement.
Capacity Management Success:
Securing adequate shipping space during peak seasons:
| Season | Baseline Fill Rate | Month 12 Fill Rate | Lost Sales Impact |
| Q1 2020 (Peak) | 78% | 100% | €0 vs. €142,000 baseline |
| Q2 2020 | 88% | 100% | €0 vs. €34,000 baseline |
| Q3 2020 | 91% | 100% | €0 vs. €18,000 baseline |
| Q4 2020 (Peak) | 82% | 100% | €0 vs. €89,000 baseline |
| Annual Impact | – | – | €283,000 additional revenue captured |
Guaranteed capacity allocation—a primary benefit of working with volume freight forwarders—eliminated the previous situation where 22% of peak harvest couldn’t ship due to container unavailability.
Customer Satisfaction Transformation
Satisfaction Score Evolution:
Customer satisfaction measured through quarterly surveys using Net Promoter Score (NPS) methodology:
| Quarter | Overall Score | NPS | Buyers “Very Satisfied” |
| Q4 2019 (Baseline) | 7.2/10 | +12 | 34% |
| Q1 2020 | 7.8/10 | +24 | 41% |
| Q2 2020 | 8.5/10 | +38 | 58% |
| Q3 2020 | 9.1/10 | +52 | 72% |
| Q4 2020 | 9.3/10 | +58 | 79% |
| Improvement | +2.1 points | +46 points | +45 percentage points |
The NPS improvement from +12 (mediocre) to +58 (excellent) indicated Delta Fresh transformed from a supplier buyers tolerated to one they actively recommended to others.
Customer Feedback Themes:
Q4 2019 (Baseline) – Negative Themes:
- “Never know when shipments will arrive”
- “Too many quality problems”
- “Poor communication—we have to chase them”
- “Documentation always has errors causing delays”
Q4 2020 (Post-Transformation) – Positive Themes:
- “Reliability matches our European suppliers”
- “Proactive communication—they update us before we ask”
- “Quality consistent and excellent”
- “Technology platform provides visibility we don’t get from other suppliers”
- “They feel like a strategic partner, not just a vendor”
Business Impact of Satisfaction Improvement:
Improved satisfaction translated directly to business growth:
- Existing buyer volume increases: +18% average across major customers
- New buyer acquisition: 5 new European customers (vs. 1 in previous year)
- Contract renewals: 100% retention (vs. 83% previous year)
- Premium pricing: Buyers willing to pay 3-5% premium for reliability
- Strategic partnership discussions: 3 buyers exploring exclusive supply arrangements
One Dutch retailer expanded Delta Fresh from 3% to 11% of their Egyptian produce purchases based exclusively on improved logistics performance—product quality remained unchanged, but delivery reliability made them confident to increase volumes.
Financial Impact Analysis
The transformation delivered substantial financial benefits across multiple dimensions:
Direct Cost Savings:
| Cost Category | Annual Baseline | Year 1 Post-Transform | Savings |
| Damage Claims | €156,000 | €33,000 | €123,000 |
| Late Delivery Penalties | €34,000 | €4,200 | €29,800 |
| Emergency Air Freight | €67,000 | €8,500 | €58,500 |
| Documentation Errors/Corrections | €23,000 | €2,100 | €20,900 |
| Customs Delays/Storage | €41,000 | €6,800 | €34,200 |
| Total Direct Savings | €321,000 | €54,600 | €266,400 |
Revenue Impact:
| Revenue Source | Baseline | Year 1 | Increase |
| Base Volume Growth | €3,200,000 | €3,450,000 | +7.8% |
| Capacity Constraint Elimination | – | +€283,000 | – |
| Premium Pricing Achievement | €2,272,000 (71% of shipments) | €3,073,000 (89% of shipments) | +€801,000 |
| New Customer Acquisition | – | +€187,000 | – |
| Total Revenue | €3,200,000 | €3,693,000 | +15.4% |
Profit Margin Improvement:
| Metric | Baseline | Year 1 | Change |
| Gross Revenue | €3,200,000 | €3,693,000 | +15.4% |
| Cost of Goods | €2,240,000 | €2,585,000 | +15.4% |
| Logistics Costs | €384,000 | €332,000 | -13.5% |
| Other Operating Costs | €416,000 | €443,000 | +6.5% |
| Net Profit | €160,000 | €333,000 | +108% |
| Profit Margin | 5.0% | 9.0% | +4.0 points |
The profit doubling resulted from three factors: revenue growth from increased volumes and premium pricing, direct cost reduction from eliminating damage/delays/emergencies, and operational efficiency gains improving productivity.
Return on Investment (ROI):
Investment in Freight Forwarding Partnership:
- Premium service fees vs. baseline: €52,000 annually
- Technology platform subscription: €18,000 annually
- Training and process improvement: €27,000 first year
- Total Year 1 Investment: €97,000
Financial Returns:
- Direct cost savings: €266,400
- Additional revenue (capacity + premium pricing): €1,084,000
- Additional profit: €173,000
- Total Year 1 Benefit: €1,523,400
ROI Calculation: (€1,523,400 – €97,000) / €97,000 = 1,470%
This exceptional ROI demonstrates that professional freight forwarding isn’t a cost—it’s a high-return investment. Every €1 invested in the partnership returned €15.70 in measurable financial benefits.
Three-Year Financial Projection:
Based on Year 1 results and planned expansion:
| Year | Revenue | Net Profit | Profit Margin | Cumulative ROI |
| Baseline (Y0) | €3,200,000 | €160,000 | 5.0% | – |
| Year 1 | €3,693,000 | €333,000 | 9.0% | 1,470% |
| Year 2 (Projected) | €4,250,000 | €468,000 | 11.0% | 2,840% |
| Year 3 (Projected) | €4,890,000 | €635,000 | 13.0% | 4,720% |
Projections assume: continued operational excellence, market expansion into new European territories, product line expansion leveraging reliable logistics platform, and growing premium pricing as reputation strengthens.
Operational Efficiency Gains
Staff Productivity Improvements:
| Metric | Baseline | Year 1 | Improvement |
| TEUs per FTE | 37.5 | 49.3 | +31.5% |
| Hours per Shipment | 8.7 | 5.3 | -39% |
| Firefighting Time (weekly) | 28 hours | 4 hours | -86% |
| Strategic Planning Time | 3 hours | 14 hours | +367% |
The efficiency gains stemmed from automation, systematic processes, and elimination of reactive firefighting. Staff shifted from constantly solving emergencies to proactive planning and continuous improvement—work that’s more satisfying and valuable.
Quality of Work Life:
Employee surveys revealed dramatic improvements in work experience:
| Factor | Baseline | Year 1 | Change |
| Job Satisfaction | 6.1/10 | 8.4/10 | +37% |
| Stress Level | 7.8/10 (high) | 4.2/10 (moderate) | -46% |
| Feel Empowered | 42% | 81% | +39 points |
| Recommend Company | 54% | 89% | +35 points |
| Intent to Stay 2+ Years | 61% | 87% | +26 points |
Improved work quality contributed to the 23% to 11% turnover reduction, saving recruitment and training costs while maintaining institutional knowledge.
Competitive Positioning Enhancement
Market Share Growth:
In Delta Fresh’s primary European markets:
| Market | Baseline Share | Year 1 Share | Change |
| German Retailers | 2.3% | 3.8% | +65% |
| Dutch Wholesalers | 4.1% | 5.9% | +44% |
| UK Importers | 1.8% | 2.7% | +50% |
| Belgian Distributors | 3.2% | 4.1% | +28% |
Market share gains came at competitors’ expense—buyers specifically cited Delta Fresh’s improved reliability as reason for volume shifts.
Competitive Differentiation:
Delta Fresh developed clear differentiation from other Egyptian exporters:
Traditional Egyptian Exporter Profile:
- 60-75% on-time delivery
- 4-7% damage rates
- Limited visibility and communication
- Reactive problem-solving
- Price-focused value proposition
Delta Fresh Profile (Post-Transformation):
- 96% on-time delivery
- 1.7% damage rate
- Real-time tracking and proactive communication
- Systematic quality management
- Reliability-focused value proposition
This differentiation enabled premium pricing and preferential treatment from buyers—Delta Fresh competed on performance, not just price.
Industry Recognition
The transformation attracted external recognition:
- Egyptian Export Council Award: “Excellence in Agricultural Exports 2020”
- Freight Forwarder Industry Recognition: Featured in annual report as transformation success story
- Customer Awards: Two major European buyers awarded Delta Fresh “Supplier of the Year”
- Media Coverage: Featured in logistics trade publications as case study in supply chain excellence
Recognition enhanced Delta Fresh’s reputation, supporting new customer acquisition and recruitment of top talent attracted to successful, growing companies.
Sustainability Improvements
An unexpected benefit emerged in environmental performance:
| Metric | Baseline | Year 1 | Improvement |
| CO2 per TEU | 2.8 tons | 2.4 tons | -14% |
| Emergency Air Freight (high carbon) | 67 shipments | 8 shipments | -88% |
| Packaging Waste | 8.3 tons | 6.1 tons | -27% |
| Food Waste (damage) | 89 tons | 19 tons | -79% |
Efficiency and quality improvements naturally reduced environmental impact—fewer damaged goods meant less food waste, optimized routing reduced fuel consumption, and eliminating emergency air freight dramatically cut carbon emissions.
European buyers increasingly prioritize sustainability. Delta Fresh’s improved environmental profile became an additional selling point, particularly with retailers facing stakeholder pressure to green their supply chains.
Replicating Success: Action Steps for Your Business
Delta Fresh’s transformation provides a proven roadmap, but each business must adapt principles to their unique circumstances. This section offers practical action steps for exporters seeking similar improvements.
Phase 1: Assessment and Baseline (Weeks 1-4)
Step 1: Document Current State Performance
Establish quantitative baseline measurements:
Operational Metrics:
- On-time delivery rate (within 24-hour window)
- Average transit time by route
- Damage/rejection rate
- Documentation accuracy rate
- Customs clearance time
- Capacity fill rate (actual shipments vs. desired)
Financial Metrics:
- Total logistics cost per TEU/shipment
- Damage claims and penalties (annual)
- Emergency freight expenses
- Lost sales from capacity constraints
- Premium pricing achievement rate
Qualitative Assessments:
- Customer satisfaction (survey your buyers)
- Employee stress and satisfaction
- Process documentation quality
- Technology capabilities
Action Tool: Create a simple scorecard tracking these metrics for 3-6 months to establish reliable baseline.
Step 2: Map Your Current Process
Document your actual freight forwarding process (not the ideal process you wish you had):
- Every step from order receipt through delivery confirmation
- All parties involved and their responsibilities
- Information flows and communication methods
- Decision points and criteria
- Problem areas and bottlenecks
Action Tool: Create a visual process map (flowchart) showing the current state reality.
Step 3: Identify Your Pain Points
Analyze where problems occur most frequently:
- Which routes/destinations experience most issues?
- What types of failures happen repeatedly?
- Which customers complain most often?
- What problems consume most staff time?
- Where do costs exceed expectations?
Action Tool: Conduct “5 Whys” analysis on your top 5 recurring problems to find root causes.
Step 4: Benchmark Your Performance
Compare your metrics to:
- Industry standards (research publications, trade associations)
- Competitor performance (where observable)
- Your best individual shipments (proves better is possible)
- Professional forwarder capabilities (request benchmark data)
Action Tool: Create a gap analysis showing your current performance versus realistic targets.
Phase 2: Solution Design (Weeks 5-8)
Step 5: Define Your Improvement Priorities
Not everything can improve simultaneously. Prioritize based on:
- Financial impact (which improvements deliver most value?)
- Feasibility (which are achievable with available resources?)
- Customer importance (which matter most to buyers?)
- Quick wins (which deliver fast visible results building momentum?)
Recommended Priority Framework:
Tier 1 (Address First):
- Issues causing customer complaints
- Problems with quantifiable financial costs
- Failures with high frequency
Tier 2 (Address Second):
- Efficiency improvements reducing internal burden
- Capability enhancements enabling growth
- Risk reductions preventing potential failures
Tier 3 (Address Later):
- Nice-to-have improvements
- Optimization of already-functioning processes
- Advanced capabilities beyond current needs
Step 6: Evaluate Build vs. Partner Options
Build Internal Capabilities:
- Pros: Control, potential long-term cost savings, internal knowledge development
- Cons: Requires expertise investment, slow development, resource intensive, lacks network leverage
Partner with Professional Forwarder:
- Pros: Immediate expertise access, technology platform, network relationships, scalable
- Cons: Service fees, dependency, less direct control
For most small/medium exporters, partnership delivers better risk-adjusted ROI unless volumes exceed 500+ TEUs annually or unique requirements demand custom solutions.
Step 7: Select Partner (If Applicable)
Use Delta Fresh’s selection criteria:
Must-Have Requirements:
- Relevant industry/product expertise
- Coverage of your target markets
- Technology platform capabilities
- Financial stability
- Positive client references
Evaluation Process:
- Create RFP (Request for Proposal) defining requirements
- Solicit proposals from 3-5 qualified candidates
- Check references thoroughly (speak with 3+ clients per candidate)
- Visit facilities and meet teams
- Compare on value (not just price)
- Negotiate service level agreements with performance accountability
Red Flags to Avoid:
- Lowest price by significant margin (suggests inadequate service)
- Reluctance to provide references
- Vague promises without specific commitments
- Poor communication during sales process
- No technology platform or very dated systems
- Financial instability indicators
Resources: Consult top freight forwarders in Egypt for evaluated options.
Step 8: Design Your Improvement Roadmap
Create a phased implementation plan:
Quick Wins (Months 1-2):
- Low-complexity, high-impact improvements
- Build momentum and prove value
- Examples: Documentation template standardization, booking horizon extension
Foundation Building (Months 2-4):
- Process documentation and SOP development
- Staff training
- Technology platform deployment
- Examples: Quality gates, systematic communication protocols
Optimization (Months 4-8):
- Continuous improvement systems
- Advanced technology utilization
- Performance refinement
- Examples: Predictive analytics, customer portal enhancement
Innovation (Months 8-12+):
- Market expansion
- New capabilities
- Strategic initiatives
- Examples: New route development, product line expansion
Phase 3: Implementation (Weeks 9-48)
Step 9: Execute Quick Wins
Start with improvements deliverable within 30-60 days:
Documentation Quick Wins:
- Standardize templates eliminating manual errors
- Create master data repository preventing transcription mistakes
- Implement 72-hour advance submission rule
- Establish four-eyes verification
Communication Quick Wins:
- Proactive customer update protocols
- Weekly internal coordination meetings
- Exception alert procedures
- Self-service tracking access for buyers
Process Quick Wins:
- Booking horizon extension (plan 21-30 days ahead)
- Pre-shipment quality checklists
- Temperature verification protocols (for perishables)
- Carrier performance tracking
Expected Impact: Even quick wins should deliver 10-20% improvement in key metrics within 60 days.
Step 10: Standardize Core Processes
Develop and implement SOPs for:
- Order receipt and booking
- Documentation preparation and submission
- Cargo handling and preparation
- Customs clearance procedures
- Customer communication
- Exception management and problem-solving
SOP Development Process:
- Document current practice (how it actually happens)
- Identify improvement opportunities
- Design improved procedure
- Create written SOP with checklists
- Train all relevant staff
- Monitor compliance
- Refine based on experience
Step 11: Deploy Technology Systems
Implement appropriate technology for your scale:
Minimum Technology Stack (All Exporters):
- Forwarder’s tracking platform (if partnering)
- Cloud document management (Google Drive, Dropbox, or similar)
- Communication tools (WhatsApp Business, Slack, or similar)
- Basic analytics (Excel or Google Sheets)
Enhanced Technology (Medium+ Exporters):
- Integrated shipment management platform
- Customer portal for self-service
- Mobile apps for field operations
- Advanced analytics and reporting
Training is Critical:
- Formal training sessions (not just “figure it out”)
- Documentation and job aids
- Ongoing support availability
- Continuous learning as capabilities expand
Step 12: Establish Continuous Improvement Mechanisms
Build improvement into regular operations:
Monthly Performance Reviews:
- KPI tracking versus targets
- Root cause analysis of failures
- Process refinement discussions
- Action item tracking
Quarterly Strategic Sessions:
- Market trends and opportunities
- Capability gaps
- Multi-quarter roadmap updates
- Resource allocation decisions
Ongoing Staff Engagement:
- Suggestion system for improvement ideas
- Recognition of contributions
- Training and development
- Open communication channels
Customer Feedback Integration:
- Post-shipment surveys
- Quarterly business reviews with major buyers
- Annual satisfaction assessment
- Continuous dialogue through multiple channels
Phase 4: Sustaining Excellence (Ongoing)
Step 13: Monitor Performance Consistently
Create dashboards displaying:
- Real-time operational status
- Performance trends over time
- Comparison to targets and benchmarks
- Leading indicators predicting future performance
Review cadence:
- Daily: Operational status, active issues
- Weekly: Performance summary, upcoming week planning
- Monthly: Comprehensive KPI review, trend analysis
- Quarterly: Strategic performance assessment
Step 14: Celebrate Wins and Learn from Failures
Success Recognition:
- Share positive customer feedback broadly
- Recognize team members contributing to improvements
- Celebrate milestone achievements
- Use success stories to build momentum
Failure Analysis:
- Conduct rigorous root cause analysis of problems
- Share lessons learned organization-wide
- Implement preventive measures
- View failures as learning opportunities, not just setbacks
Step 15: Scale and Expand
As performance stabilizes and improves:
- Expand into new markets leveraging reliable logistics platform
- Increase volumes with confident customers
- Add product lines that logistics capabilities support
- Invest savings and additional profits in business growth
Growth Enablers:
- Reliable logistics reduces market entry risk
- Strong performance provides references for new customers
- Operational efficiency creates capacity for growth
- Improved margins fund expansion investments
Common Pitfalls to Avoid
Pitfall #1: Attempting Too Much Too Fast Solution:
Phased approach focusing on high-impact priorities
Pitfall #2: Underestimating Change Management Solution:
Invest time in communication, training, and stakeholder engagement
Pitfall #3: Choosing Partners Based Solely on Price Solution:
Value-based selection considering total cost and ROI
Pitfall #4: Neglecting Measurement Solution:
Establish baselines and track progress systematically
Pitfall #5: Treating as One-Time Project vs. Continuous Journey Solution:
Build ongoing improvement into organizational culture
Pitfall #6: Inadequate Documentation Solution:
Create SOPs, record decisions, maintain institutional knowledge
Pitfall #7: Poor Communication Solution:
Over-communicate during change; transparent, frequent updates
Pitfall #8: Lack of Executive Sponsorship Solution:
Ensure leadership commitment and visible support
Resources for Support
Educational Resources:
- How to Export from Egypt – Comprehensive guide
- Modern Shipping Services – Industry trends and best practices
- Industry trade associations (FIATA, IATA, local chambers of commerce)
- Professional training programs and certifications
Service Providers:
- GCT Freight Services – Comprehensive logistics solutions
- Sea Freight Services – Ocean transport expertise
- Customs Clearance – Regulatory compliance support
- Air Freight – Alternative transport when needed
Tools and Templates:
- Forms & Documents – Standardized templates
- Performance tracking spreadsheets
- SOP templates and examples
- Project planning tools
Next Steps:
Ready to begin your transformation? Start with:
- Assessment: Measure your current performance baseline
- Education: Review this case study and related resources
- Consultation: Contact GCT Freight for expert guidance
- Action: Begin with quick wins building momentum
The freight forwarding case study of Delta Fresh proves that dramatic improvement is achievable for Egyptian exporters of all sizes. The question isn’t whether transformation is possible—it’s when you’ll begin your journey.
FAQs:
What were the main logistics problems Delta Fresh was facing?
Delta Fresh struggled with inconsistent shipping times, frequent customs holds due to documentation errors, poor cold chain management leading to high damage rates, an inability to secure containers during peak season, and a complete lack of real-time shipment visibility.
How did a freight forwarder help reduce shipping delays?
The freight forwarder provided expertise in documentation to prevent customs holds, used their volume to guarantee container space, optimized carrier selection for reliable schedules, and implemented technology for real-time tracking, allowing for proactive issue resolution.
What specific results did Delta Fresh achieve after the partnership?
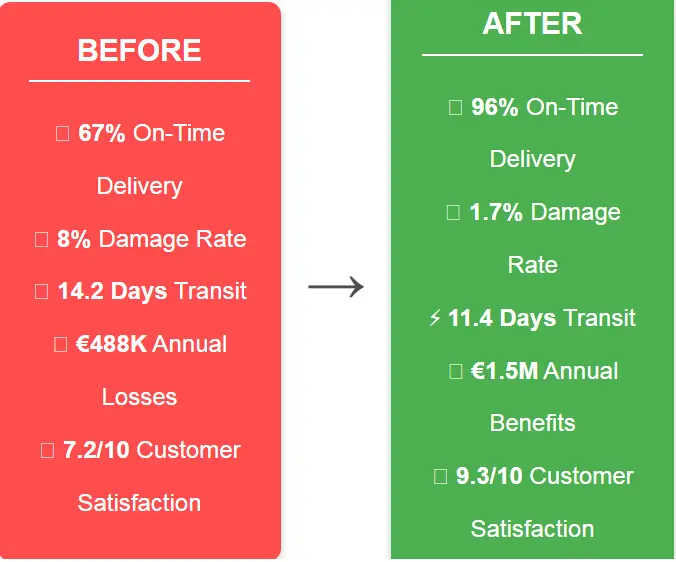
Key results included:
- Shipping delays reduced by 73%
- On-time delivery improved from 67% to 96%
- Damage rate dropped from 8% to 1.7%
- Annual profits increased by 15%
- Achieved a 1,470% ROIon their investment in the partnership.
Is this case study only relevant for agricultural exporters?
No. While the case study focuses on perishable goods, the core principles of process standardization, expert partnership, technology adoption, and continuous improvement apply to any export business where reliability, speed, and cost efficiency are critical, such as textiles, manufactured goods, and other commodities.
What is the first step a company should take to improve its freight forwarding process?
The first step is to conduct a thorough assessment. Document your current performance by establishing baselines for key metrics like on-time delivery, damage rates, and transit time variability. This data will reveal your biggest pain points and provide a benchmark to measure future improvements against.
Why not just manage logistics in-house to save on freight forwarder fees?
As the case study shows, attempting to manage logistics in-house without specialized expertise often leads to higher total costs. These “hidden costs” come in the form of damage claims, late penalties, emergency air freight, lost sales, and missed premium pricing opportunities, which far exceed the professional fees of a forwarder.
Where can I learn more and get started?
Educational Resources:
GCT Freight Resources:
- Blog – Ongoing insights and updates
- Resources Page – Guides and tools
- Forms & Documents – Templates and checklists
Related Articles:
- How to Export from Egypt – Comprehensive export guide
- Sea Export Freight Forwarding Process – Detailed process breakdown
- Top Freight Forwarders in Egypt – Provider evaluation
- Modern Shipping Services – Industry trends
Industry Organizations:
- FIATA – International Federation of Freight Forwarders Associations
- ICC – International Chamber of Commerce (Incoterms, trade rules)
- WCO – World Customs Organization
- Egyptian Export Council – Local export support
Getting Started with GCT Freight:
Step 1: Initial Consultation
- Contact GCT Freight for complimentary consultation
- Discuss your current challenges and objectives
- Receive preliminary assessment and recommendations
Step 2: Comprehensive Evaluation
- Detailed analysis of your current operations
- Benchmark performance against industry standards
- Identify specific improvement opportunities
- Develop customized solution proposal
Step 3: Pilot Program
- Start with limited volume to demonstrate value
- Implement core processes and systems
- Measure results against defined metrics
- Evaluate performance and ROI
Step 4: Full Implementation
- Scale successful pilot to full operations
- Comprehensive process transformation
- Technology platform deployment
- Continuous improvement systems
Contact Methods:
Chat with Our Team on WhatsApp
OR Website: GCT Freight Services Book Pick-Up: Schedule Service Service Pages:
What to Prepare for Initial Consultation:
- Current shipment volumes and patterns
- Destinations and routes
- Product types and special handling requirements
- Known pain points and challenges
- Performance data if available (on-time rates, damage rates, costs)
- Growth objectives and timeline
No-Obligation Assessment: GCT Freight provides complimentary initial assessment helping you understand improvement potential and investment requirements before any commitment.